Voting Patterns by Demographic Groups in Midterm Elections
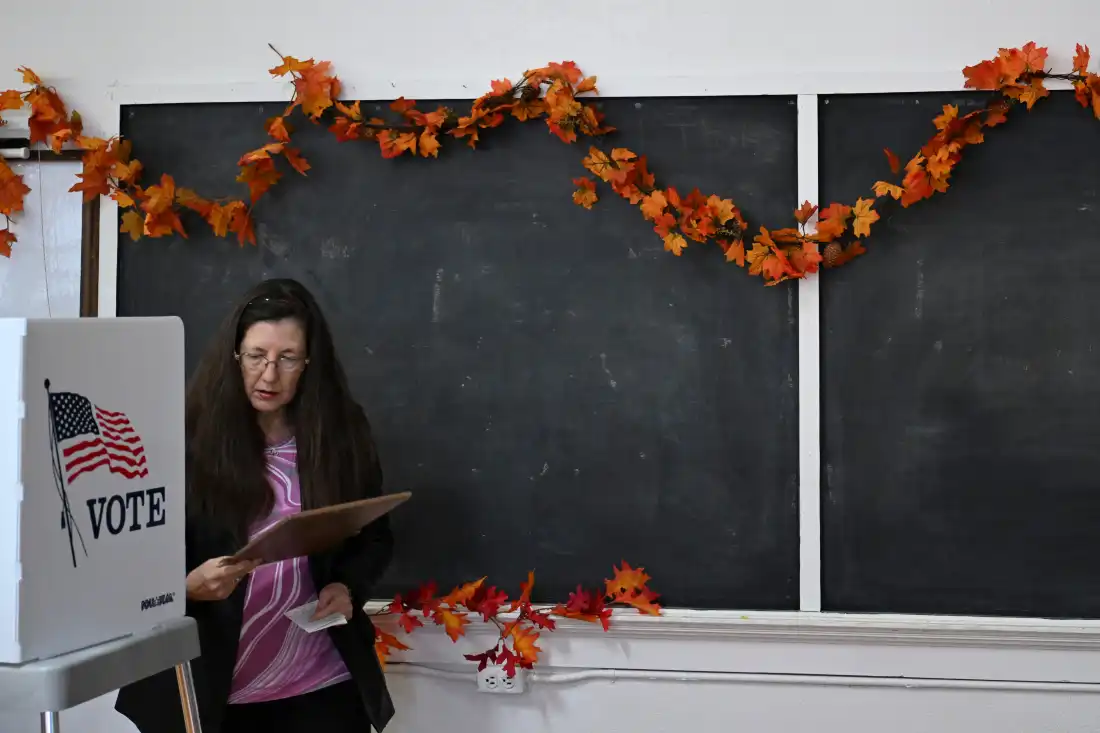
Bonnie Ford participated in the elections at De Borgia School located in De Borgia, Montana, on Tuesday. Her action coincides with the release of comprehensive data illustrating how different demographic groups voted during the midterm elections.
The information provided here unveils the percentage of voters who expressed their choice for House candidates from each political party. This data has been extracted from a sizeable poll conducted by SSRS. The poll surveyed tens of thousands of voters and was carried out in partnership with numerous news organizations, including the Associated Press.
The results obtained from the poll have a margin of error of plus or minus 0.6 percentage points. This indicates a high level of accuracy in capturing the voting behaviors and preferences exhibited by various demographic segments. These insights are crucial for understanding the dynamics of voter engagement and party support across the nation.