Spokeo’s Halloween Insights: Best States for Trick-or-Treating
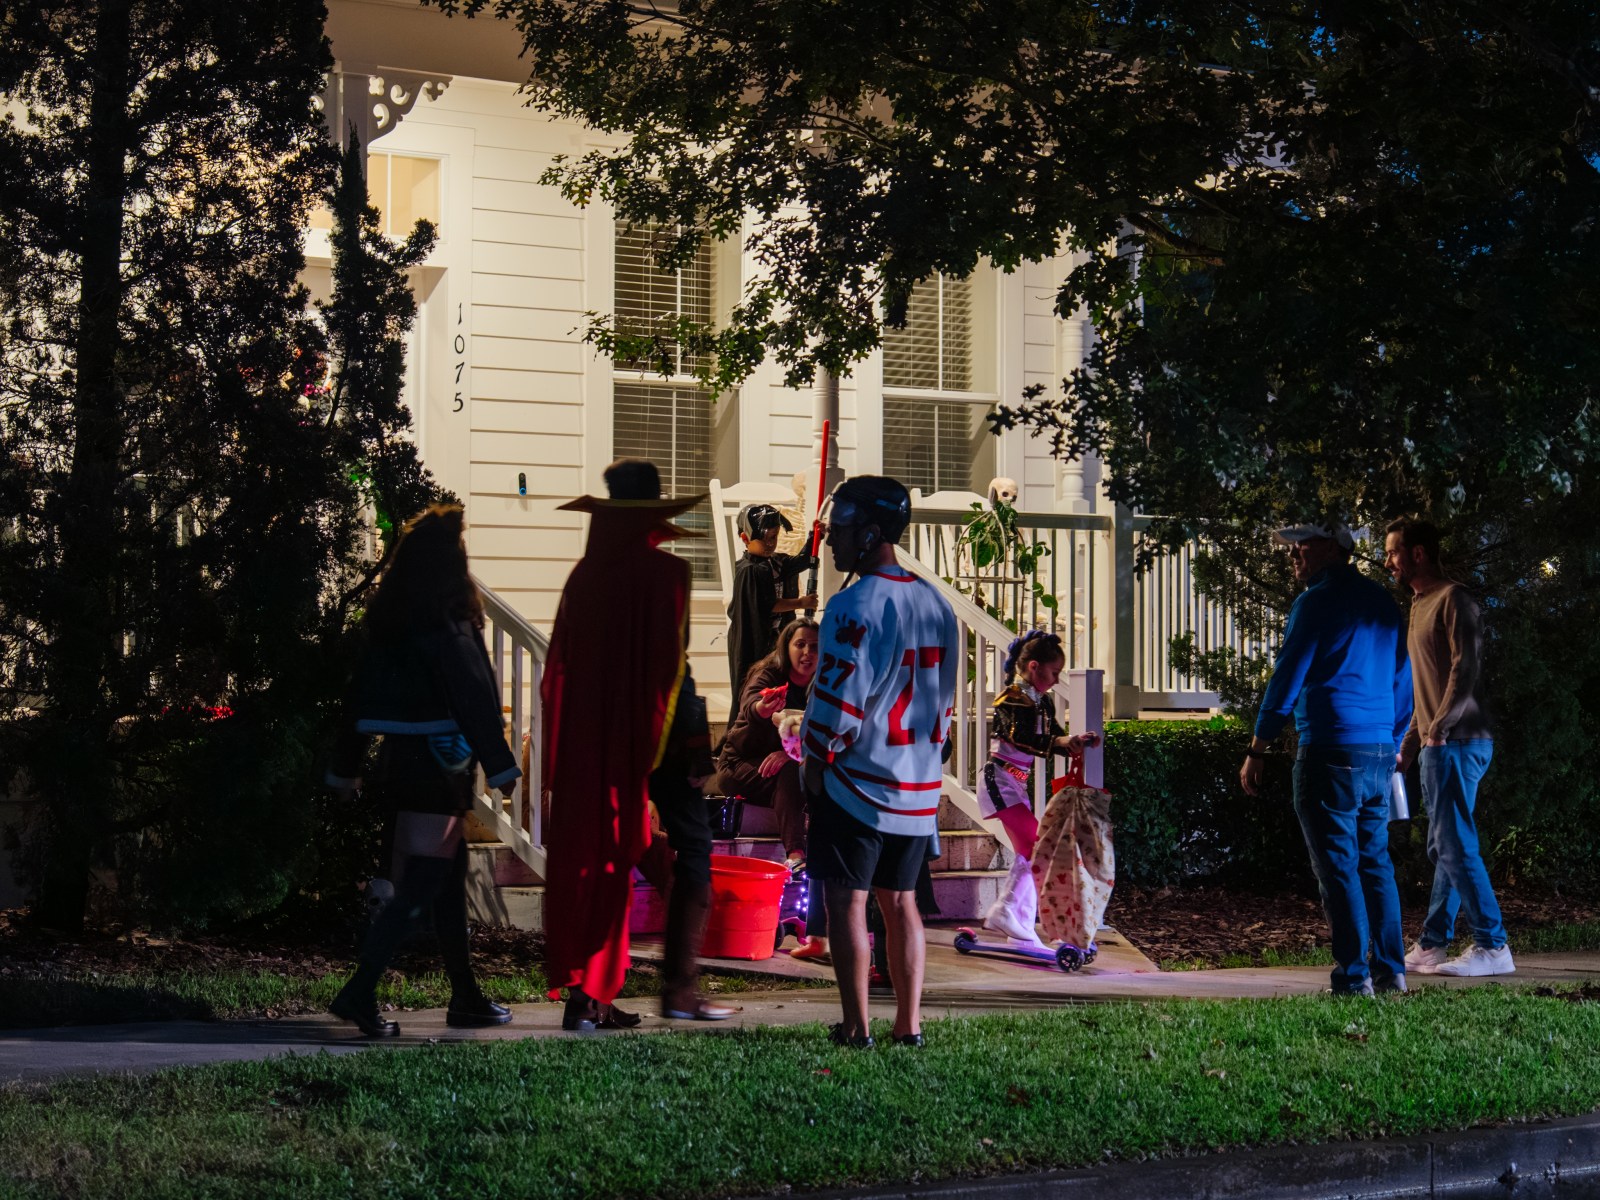
Halloween holds a special place for many in the U.S. Dressing up and enjoying treats make the holiday enjoyable. Halloween is also a significant economic event. The National Retail Federation predicts that Americans will spend around $13.5 billion on Halloween this year, marking a slight increase from last year. Spending on candy alone is expected to reach $4.1 billion. This translates to roughly $115.14 per person, with 96% of shoppers planning to buy sweets.
Some states excel as prime locations for trick-or-treating. Using data from the National Retail Federation, the Census, and the National Centers for Environmental Information, Spokeo has ranked all 50 states based on trick-or-treating quality. This ranking helps gauge how much candy one can expect on October 31.
There are various factors affecting Halloween candy collection.
Desirable neighborhoods have many children and dense housing. Homes with illuminated pathways make it easier for trick-or-treaters. Spokeo’s index evaluates states based on these factors using data from federal Census and weather sources.
Understanding the Index
The index assigns scores from 0 to 100 to each state across four categories, leading to an overall score. The top states in each category earn a score of 100. The categories include:
- Households with children under 18: The percentage of households with kids is pivotal; data comes from the Census Bureau’s American Community Survey (2020-2024 estimates, Table B11005).
- Housing density in populated tracts: More housing units per square mile provide more opportunities for candy. This factor avoids inaccuracies due to empty lands by focusing on populated areas. The data used comes from the Census survey (Table B25001) and TIGER/Line tract geography.
- Single-family detached share: Ideal for trick-or-treating, this factor considers the percentage of single-family detached homes using data from Table B25024.
- Weather considerations: Rain can deter trick-or-treaters. Data from the NOAA (1991-2020 daily climate normals) assesses the typical October 31 weather.
Top States for Trick-or-Treating
The heatmap indicates your location affects trick-or-treating success:
Utah leads, followed by Texas, Oklahoma, California, and Mississippi. Utah boasts the highest share of households with children at 38%. Texas follows with 35%. California ranks well across children’s population, housing density, and weather. Oklahoma ranks second in single-family housing at 73%, and Mississippi enjoys favorable Halloween weather at around 60 degrees.
Idaho’s example stands out. It ranks first in single-family housing at 74% and fourth in households with children but doesn’t break into the top five overall.
Index Limitations
No index fully encapsulates a good Halloween night. Factors like candy-giving households, street safety, traffic patterns, or organized events aren’t covered. State-level figures also blend city and sprawling suburban data. However, abundant children, close housing, and dry weather increase your chances of a successful Halloween.
Despite different rankings, national spending indicates ample candy supply. High spending suggests a fun Halloween for all, regardless of state rank.